Say you have no purifying selection, meaning 0 infant mortality. All kids who are conceived grow up to be adults. But you have the following facts: every year after the age of 8, a male’s sperm cells accumulate on average 2 de novo mutations each. Also, you have the following chart (all the data in this article is simulated):
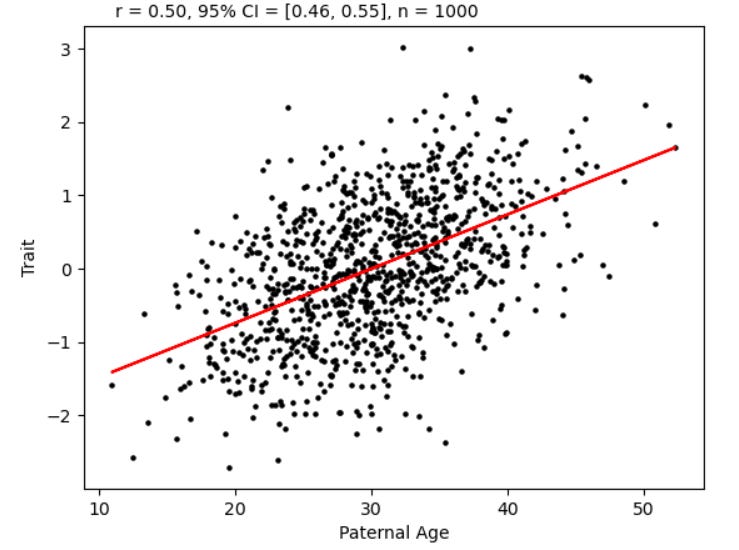
Where paternal age is the age of your father.
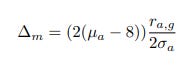
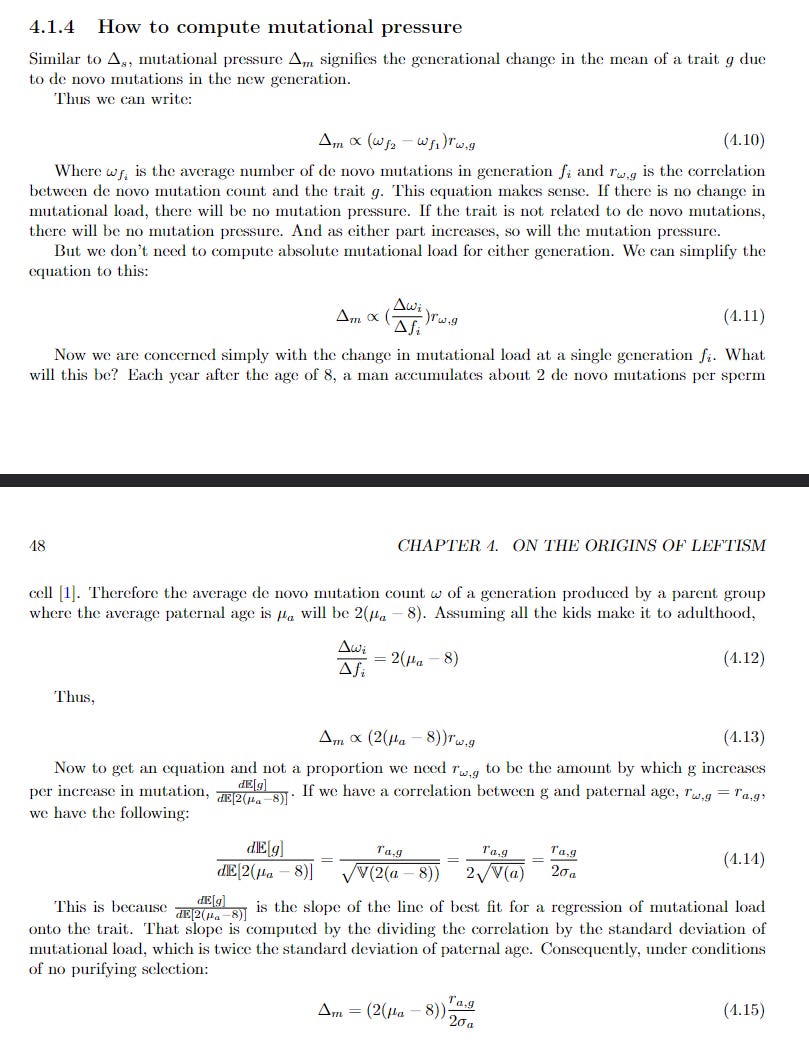
From just this knowledge we can compute the mutational pressure on the trait, which is how much the trait changes per generation due to the accumulation of new de novo mutations.
This is because mutational load correlates with paternal age.
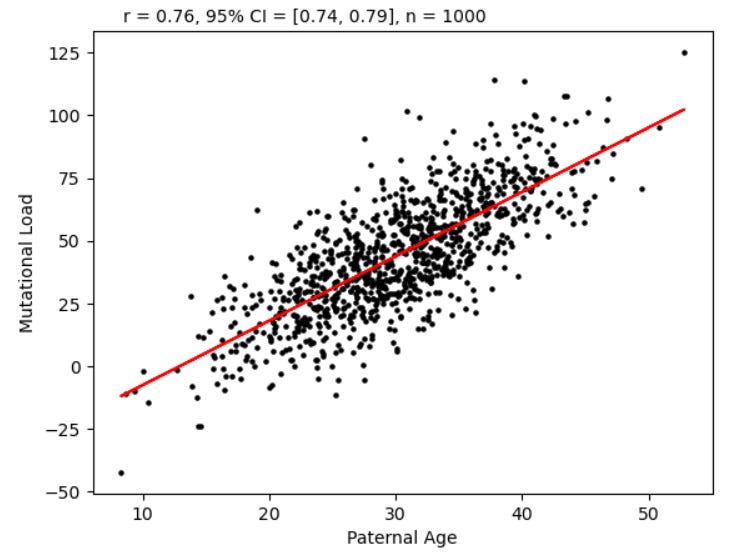
This implies the following:
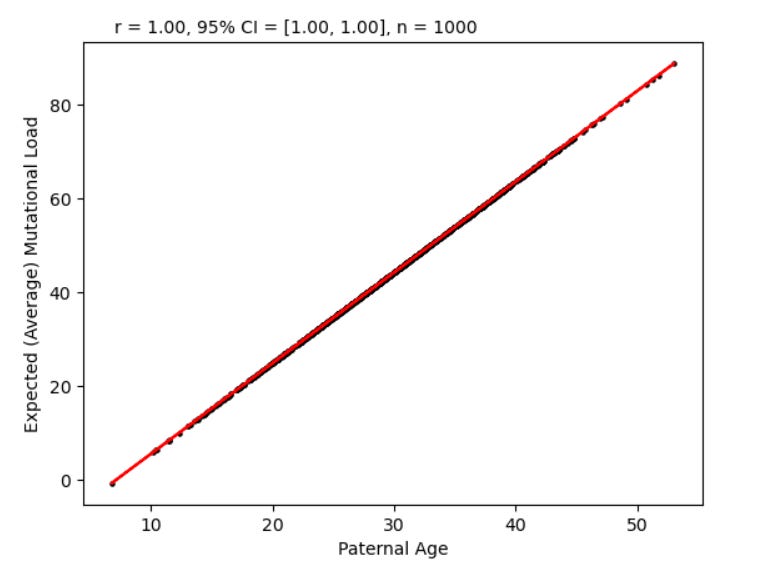
This is because the average mutational load given paternal age is just the line of best fit for the correlation between paternal age and mutational load. We know empirically that this line of best fit increases by two for every year of paternal age and has an intercept of 8.
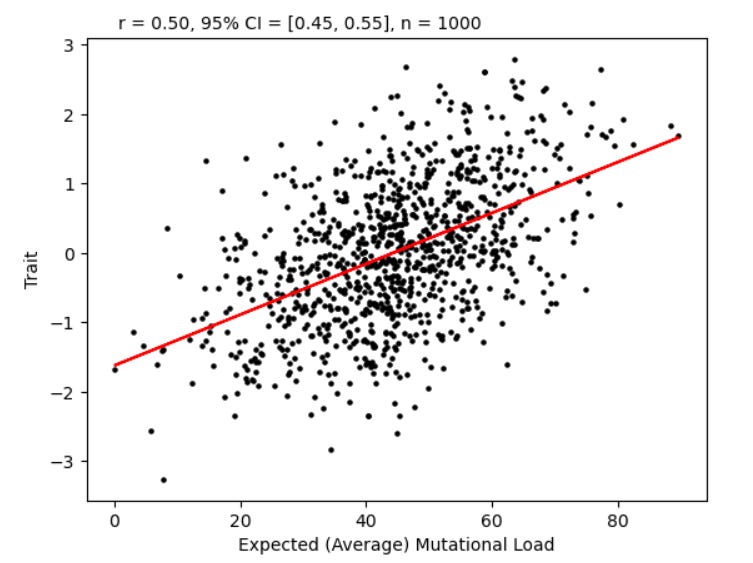
What this means is we can just change the x axis of the first chart to be expected mutational load:
Comments
No comments yet.
Log in to leave a comment.