There's a folk intuition floating around that knowing the phenotype of someone's parents and extended relatives is very important for predicting their genotype, even when you already have the individual's phenotype. The intuition here seems to be that phenotype is a noisy reflection of genotype, but the average of familial phenotypes is going to be more of a reflection of the individual's underlying genotype.
This would be true if it weren't for the fact that the genotypic variance of siblings is half that of the parent's generation. This means that there's a lot of genotypic variance within a family. Parental midpoint genotype will explain half the variance of offspring genotype, and the marginal predictive value of more distant relatives will be progressively halved. Both grandparent midpoints, for instance, will, on their own, explain only a quarter of the variance of grand-children genotypes.
The marginal variance of parental phenotypic midpoint on top of offspring phenotype will be lower still. And it's clear that the marginal of predictive value of more distant phenotypes will continue to decrease exponentially. They should collectively be no more than the marginal predictive value of parental midpoint, since the value of each is halving and 1/4 + 1/8 + 1/16 ... = 1/2.
This can be shown by simulation, but it's also easy to analyze this by hand. Let's have the following regression equation:
G = \beta_p P + \beta_f F + \epsilon
Where g is the individual genotype, p is the individual phenotype, and f is the parental midpoint phenotype. From the regression anatomy formula:
\beta_f = \frac{Cov(F - \beta_{F,P}P, G)}{Var(F - \beta_{F,P}P)}Where the beta is the beta from the regression of F on P, meaning predicting F from P. The top term is:
Cov(F - \beta_{F,P}P, G) = Cov(F,G) - \beta_{F,P}Cov(P,G) = \frac{h}{2} - \beta_{F,P}hWhere h is the square root of the trait's heritability.
\beta_{F,P} = \frac{Cov(F,P)}{Var(P)} = Cov(F,P) = \frac{h^2}{2}Now the bottom term:
Cov(F - \frac{h^2}{2}P, F - \frac{h^2}{2}P) = Var(F) + Var(\frac{h^2}{2}P) + 2Cov(F, -\frac{h^2}{2}P) = \frac{1}{2} + \frac{h^4}{4} - 2\frac{h^4}{4} = 0.50 - 0.25h^4So the beta is:
\beta_f = \frac{\frac{1}{2}h - \frac{1}{2}h^3}{\frac{1}{2} - \frac{1}{4}h^4}You can manipulate this to get that it's roughly h-h^3, which is interesting because the non-marginal beta is h, so the marginal beta is strictly less. This is still a somewhat unintuitive polynomial, so it's easiest to just graph the whole thing.
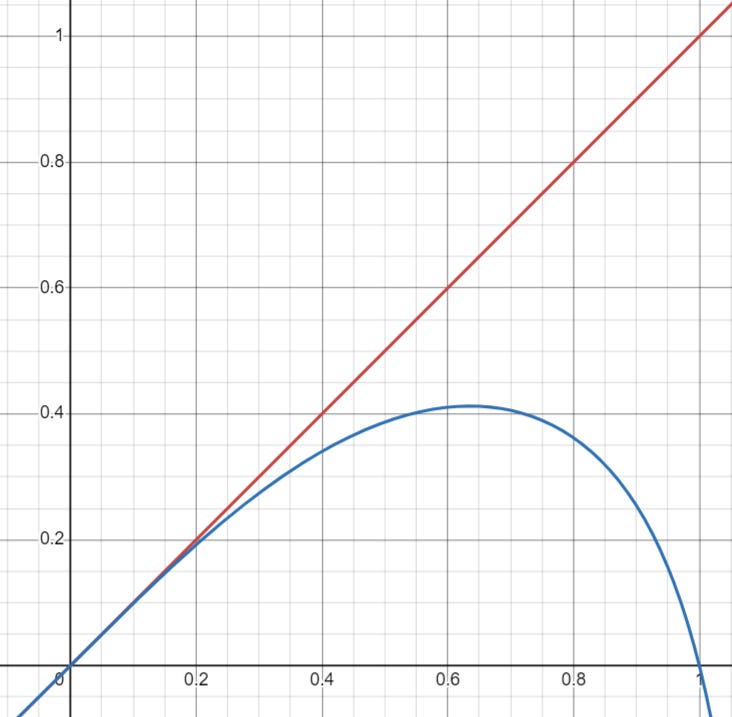
We see that the line is h, which is the correlation between F and G, and the curve is beta_f. The curve is always less than the line, and peaks at intermediate heritabilities. When heritability is low, genetic information is generally not that predictive, and the marginal predictiveness of parental traits is not much less than the total predictiveness. As h gets quite large though, it becomes similar to individual phenotype, and the marginal predictiveness of parental phenotype goes to 0.
Now let's do the same for the other beta.
\beta_p = \frac{Cov(P - \beta_{P,F}F,G)}{Var(P - \beta_{P,F}F)}The top term is, using the same logic as above:
Cov(P - \beta_{P,F}F,G) = h - \frac{h^3}{2}The bottom term is:
Cov(P - \beta_{P,F}F, P - \beta_{P,F}F) = Var(P) + \beta_{P,F}^2 Var(F) - 2\beta_{P,F}Cov(P,F) = 1 + \frac{h^4}{2} -2h^2(\frac{h^2}{2}) = 1 - \frac{h^4}{2}So we get:
\beta_p = \frac{h - \frac{1}{2}h^3}{1- \frac{1}{2}h^4}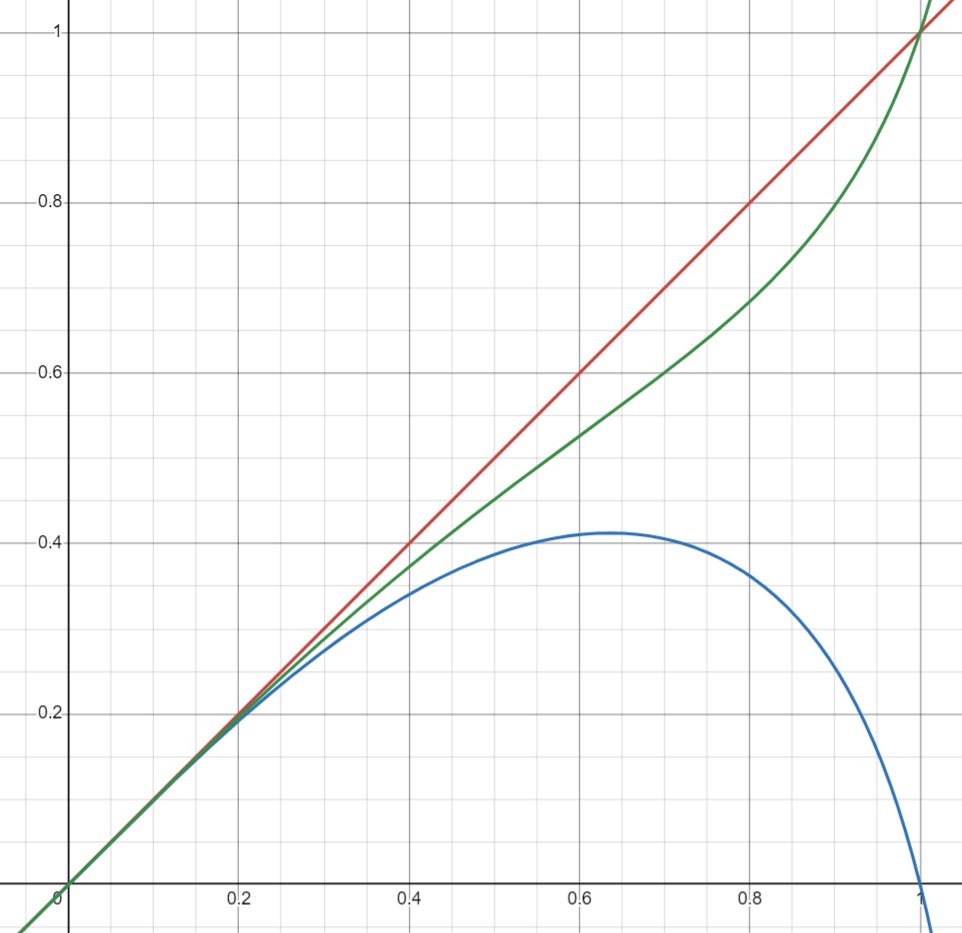
The green curve shows the marginal predictiveness of individual phenotype for each h. It’s always superior to parental midpoint and always increasing.
Finally, we have:
R^2 = Var(\beta_p P) + Var(\beta_f F) + 2Cov(\beta_f F, \beta_p P) = \beta_p^2 + \frac{\beta_f^2}{2} + h^2 \beta_f \beta_p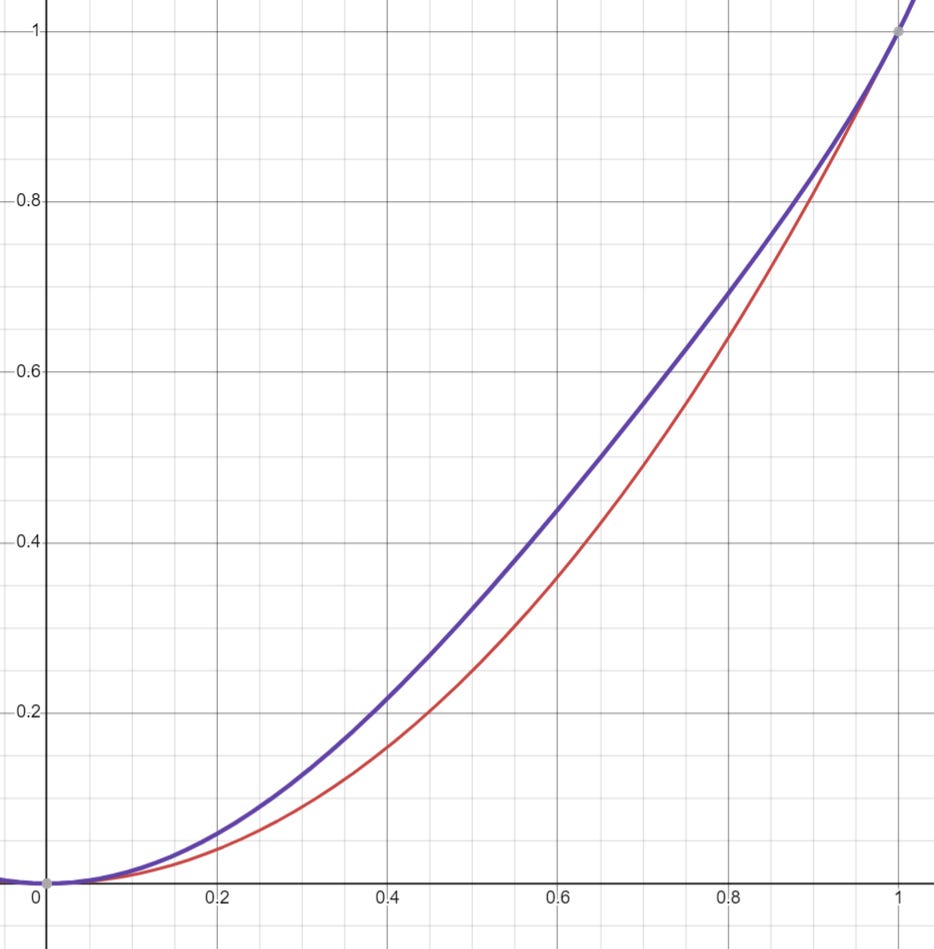
The purple curve is R^2 plotted by h while the red curve is h^2, the variance explained by parental midpoint or individual phenotype alone given h. R^2 is never less than h^2 but it’s never much more.
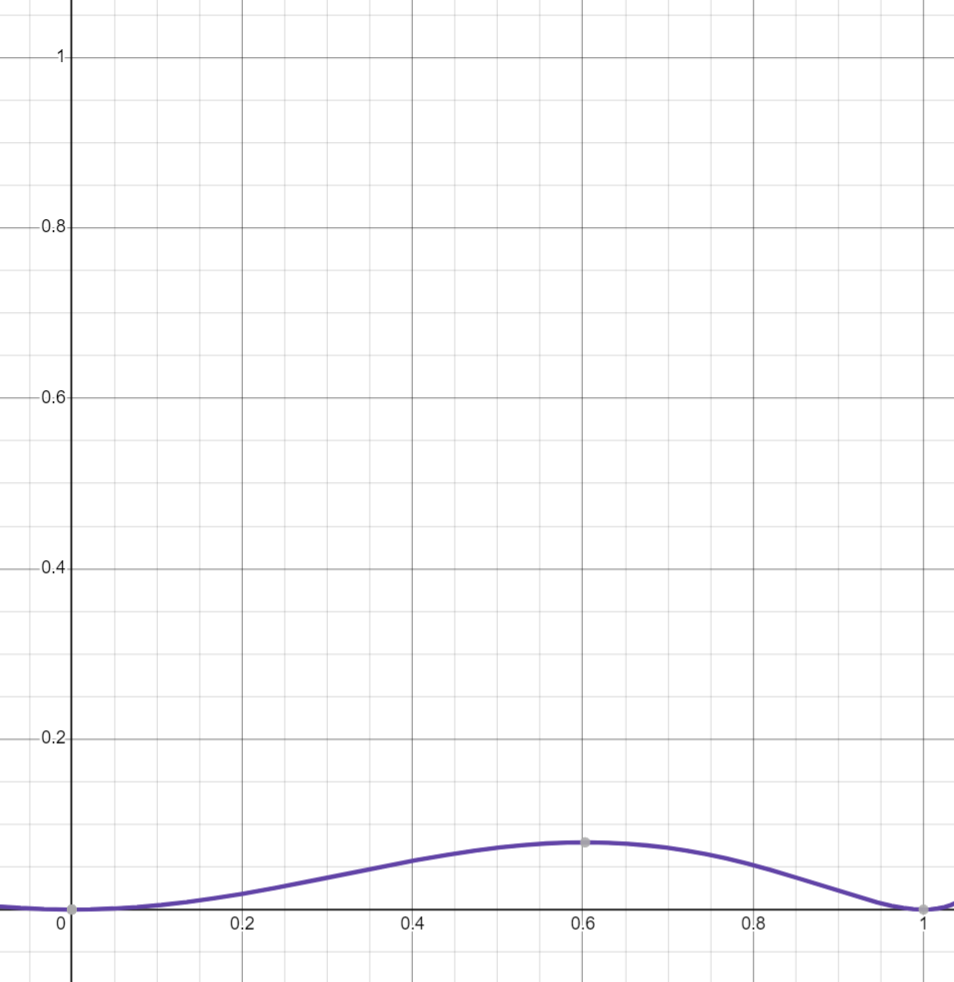
The maximum gain is about 7% of the variance when h=0.60, or h^2 = 36%. At high IQ-like h’s, the variance-explained gain is <5%, which means the variance-explained gain from all family members should be <10%.
Conclusion
Ancestral family phenotypes are not very marginally informative of individual genotypes, given the individual’s phenotype.
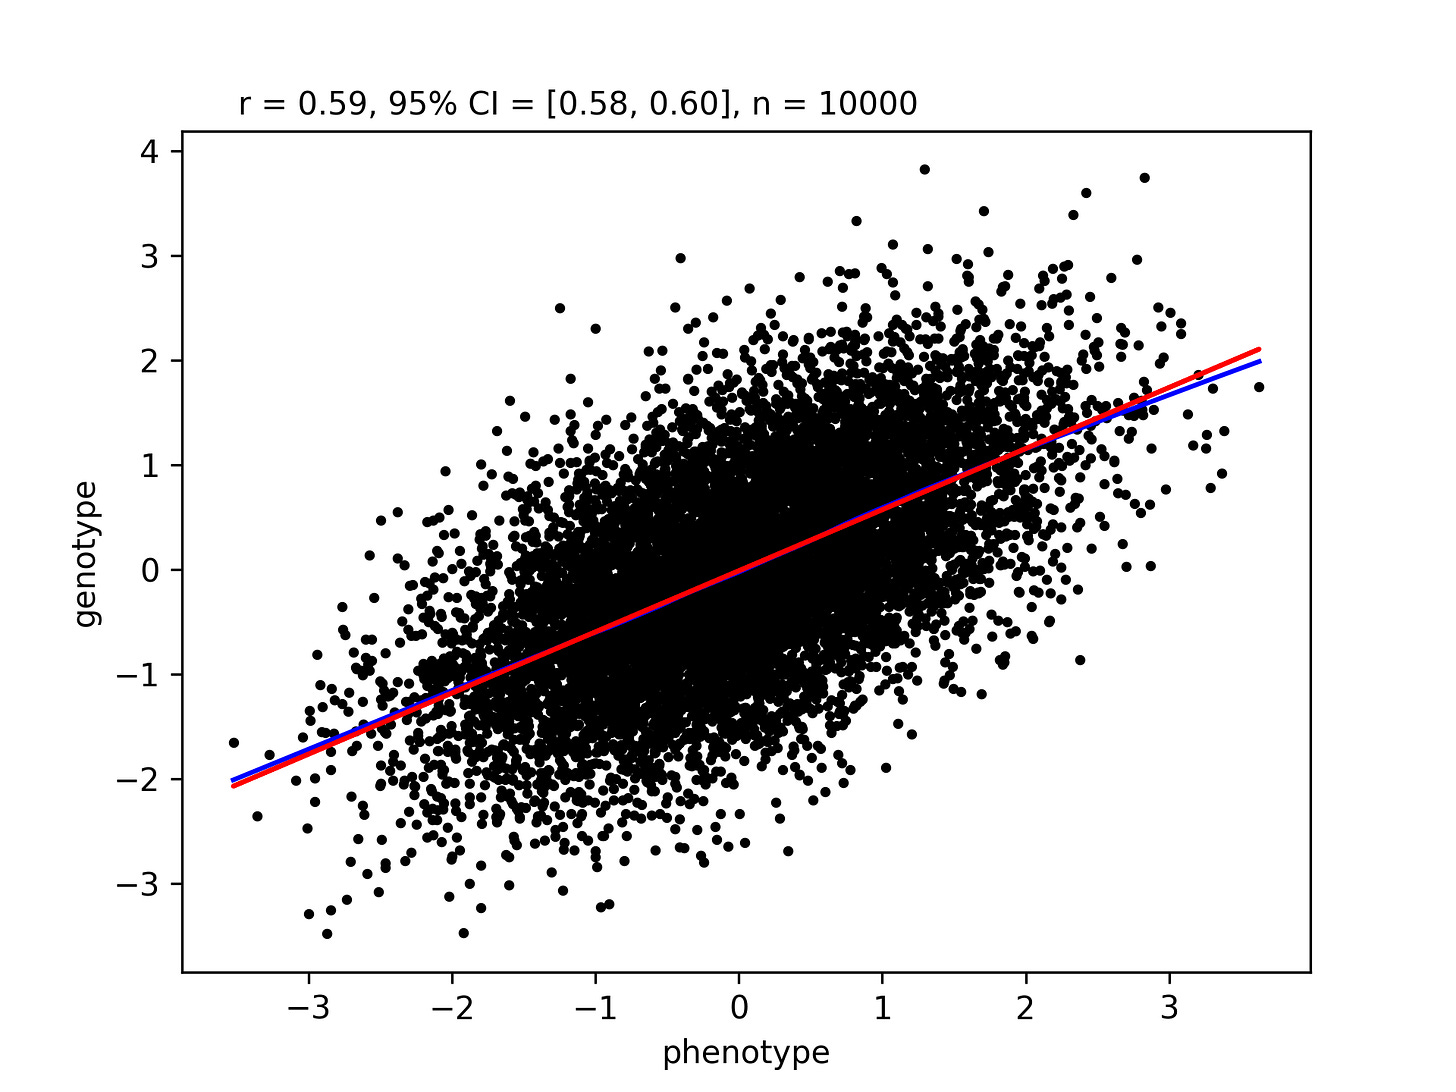
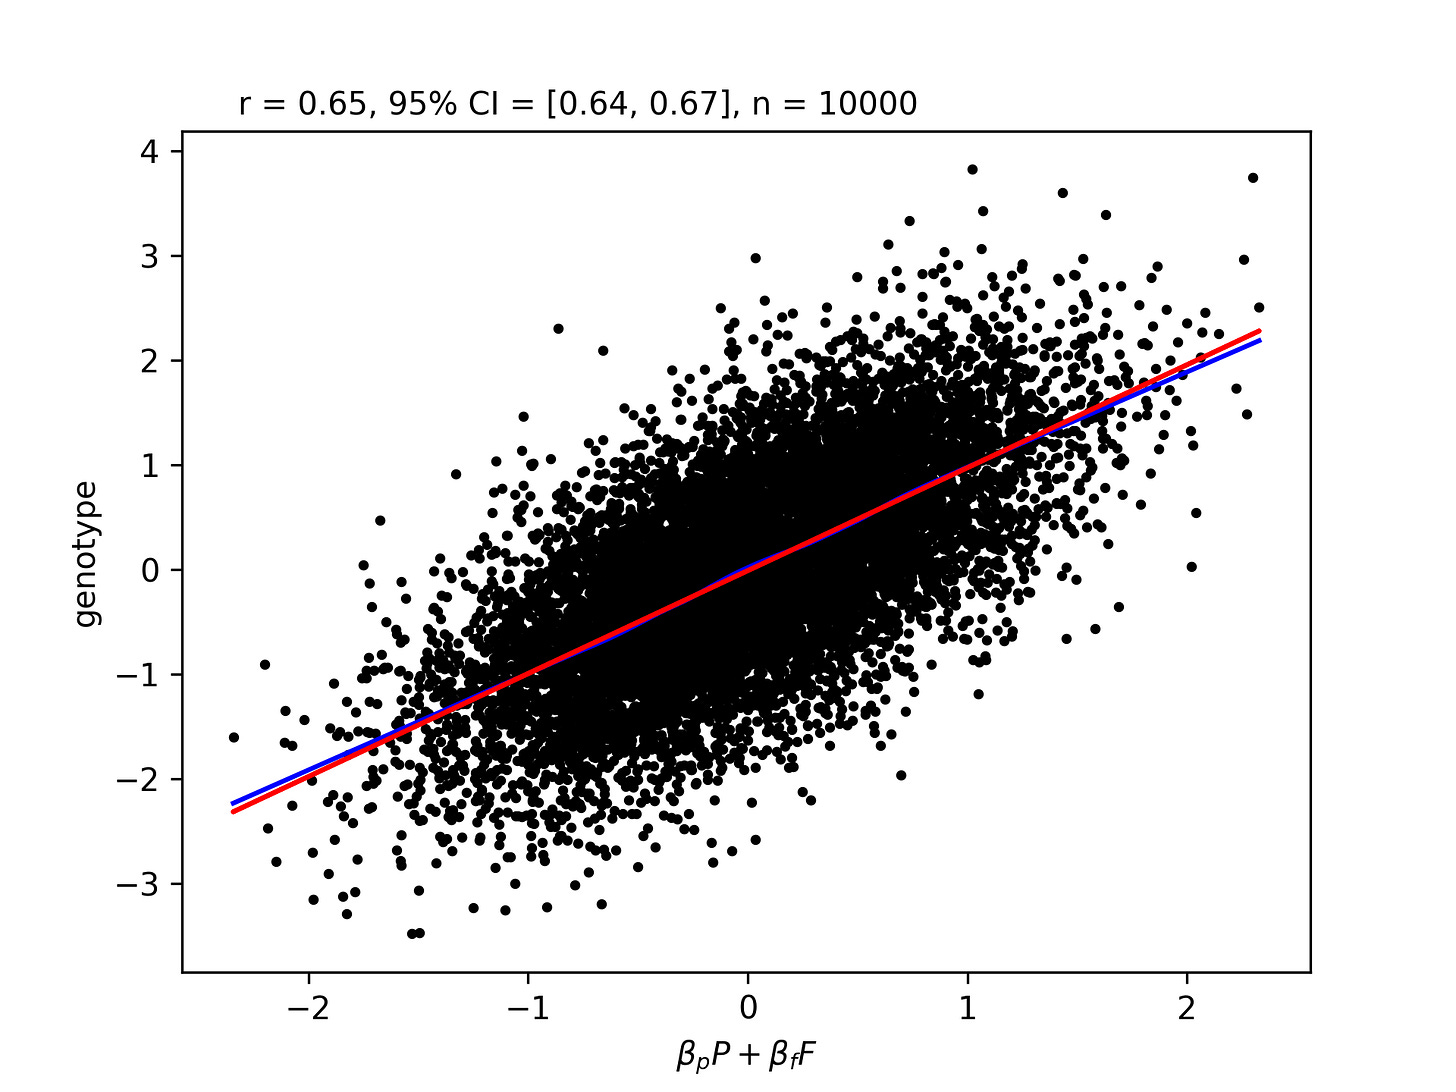
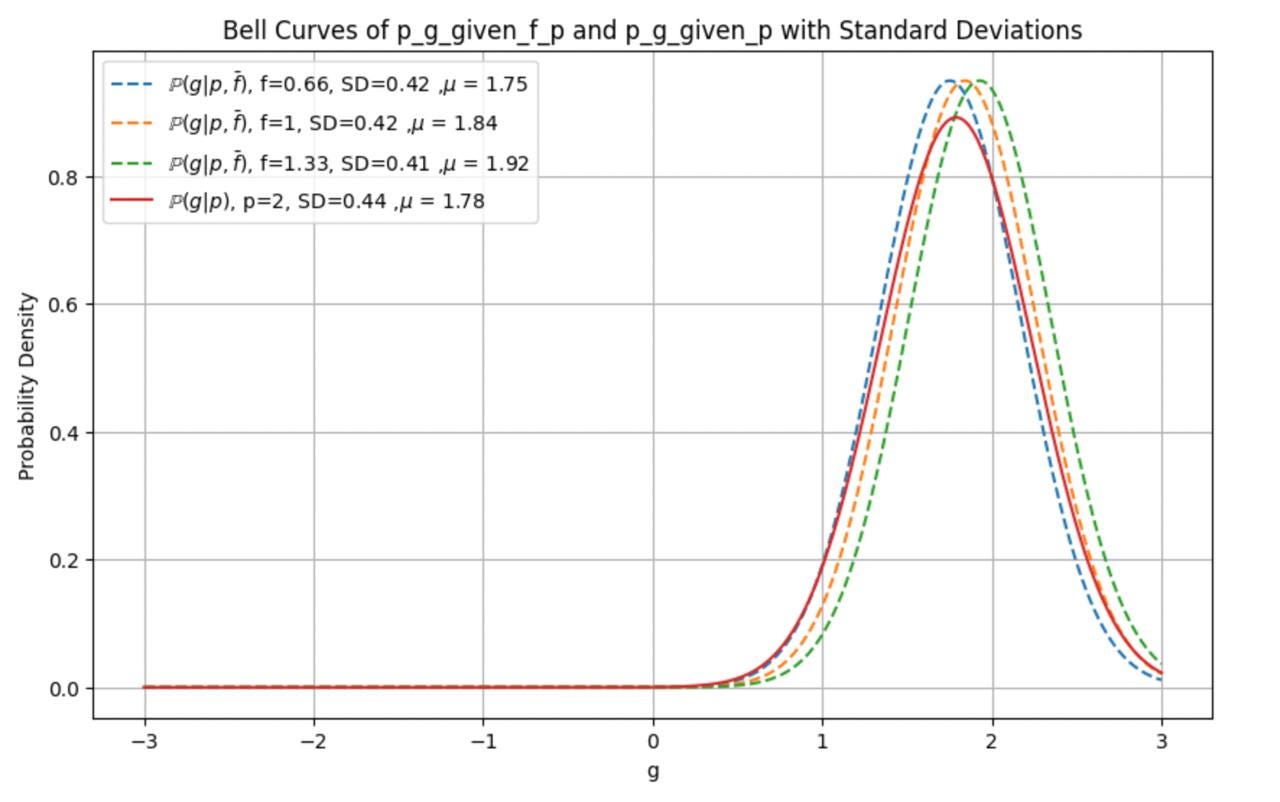
Given an individual’s phenotype, you are probably not going to see much variance in parental midpoint phenotypes. With regards to IQ, parental midpoints only have SDs of about 10 since they are averages of 2. The high heritability of IQ reduces the SD of parental midpoints further to roughly 5, given an individual’s phenotype.
Comments
No comments yet.
Log in to leave a comment.